You may know that many statistical software packages can generate biplots. However, GGEbiplot not only generates perfect biplots of all possible models but also analyzes them in all possible ways, many of them novel and unique. Further, GGEbiplot is created for use by all researchers, not just stats wizards...
| File | View | 4-Way Data | Biplot Tools | Association Biplot | Canonical Biplot | Format | Models | Data | Biplots | ANOVA | Breeder's Kit |
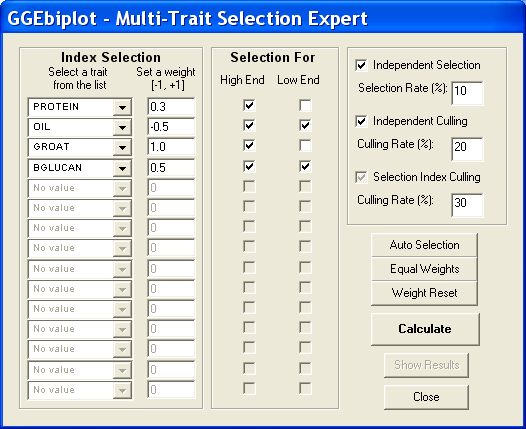
Multi-Trait Selection Index calculator in GGEbiplot combines three major selection strategies, i.e., Index Selection, Independent Selection, and Independent Culling in a single user-friendly interface, and is a powerful tool for genotype evaluation and selection.
|
MENU LIST |
Description/Comment (if not self-evident) |
||
|
Accessories |
|
|
Accessories are not biplot analysis per se. But they are equally important for understanding your data. You may find many functions under this title are unique to other statistical software packages. |
|
|
Data Plotting |
|
This data plotting tool is unique and very useful for… |
|
|
|
Two Testers |
Comparing two testers for each of the individual entries |
|
|
|
Two Entries |
Comparing two entries for each of the individual testers |
|
|
|
Equality Line |
|
|
|
Numerical Output |
|
|
|
|
|
Original Data in a 2-way table |
Prints the original data, organized into a two-way table if it was not read so, to a log file, which records the numerical events during the biplot analysis. |
|
|
|
Current (Subset) Data |
Prints the current subset that is displayed in the biplot to the log file. |
|
|
|
Predicted Values |
Prints predicted values based on the biplot to the log file. |
|
|
|
Eigenvectors |
Prints the eigenvectors to the log file. |
|
|
|
Biplot Axes |
Prints the values that are used to generate the current biplot. You can generate your own biplot using Microsoft Excel using these values. |
|
|
|
Correlation matrix among testers |
Calculates the Pearson correlation between each pair of the testers and printed the correlation matrix into the log file. Threshold values for 5% and 1% significance are also provided. |
|
|
|
Distance matrix among testers |
Calculates the biplot distance (dissimilarity) between each pair of the entries and prints the distance matrix into the log file. |
|
|
|
Tester Vector Length |
Calculates and prints the vector length of the testers. Under certain models, vector length is a measure of the power of the tester for discriminating among the entries. |
|
|
Breeder's Kit |
|
|
|
|
|
Mean vs. Stability Deviation |
This generates a plot of the entries, with X as the means across testers and Y as the square root of Shukla’s interaction variance, which is a measure of the entry’s stability. |
|
|
|
YREM (Superiority Index) |
This is a measure of the superiority of the entries (genotypes) across testers (environments). It is defined between 0 and 1. |
|
|
|
Independent Culling |
This evokes a function that allows visually discarding entries based on their performance with regard to each tester. |
|
|
|
Multi-Trait Selection Index |
The data are first standardized based on each trait/variable. A weight between -1 to +1 is assigned for each trait. A Selection Index is then calculated for each genotype and the genotypes are ranked based on this selection index. |
|
|
|
Plot Randomization |
This evokes a plot randomization procedure. Compete or incomplete block designs can be generated instantly. |
|
|
|
R-t-P converter |
This is a correlation (r), student t (t), and probability (p) calculator. Give any one of them, given the number of observations, the other two will be automatically calculated. |