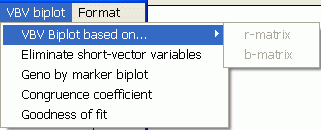
VBV biplot

"VBV biplot" was previously referred variably to QQE biplot, Covariate-effect Biplot, or "Canonical Biplot", etc. However, "variable-by-variable (VBV) biplot" seems to be more accurate for the biplot that GGEbiplot generates to depict the interrelationships between two types of variables.
The term "VBV analysis" is used in this documentation to refer to studies of the interrelationships among two sets of variables, namely, a set of response variables and a set of explanatory variables. This type of analysis may be more appropriately referred to as "variable by variable" (VBV) analysis.
Given a two-way table that contains two sets of variables, this module can do the following:
These functions can be used in the following scenarios:
1) Genetic markers as explanatory variables and phenotypic data of a target trait in different environments as response variables:
2) Genetic values of explanatory traits as explanatory variables and phenotypic data of a target trait in different environments as response variables:
3) Genetic markers as explanatory variables and a set of target traits in one environment or averaged across environments as response variables:
Note: This type of analysis is similar to but is different from the so-called canonical analysis. The common point is that both try to study relationships between two sets of variables (response variables and explanatory variables). The difference is that canonical analysis tries to find the linear combinations within each set of variables that correlates the strongest, while covariate-effect analysis tries to identify the most important explanatory variables that are associated with the response variables.