Functions for gene expression (microarray)
data
Gene expression data or microarray data, in the
form of a gene-by-chip two-way table, is just one type of two-way tables that
can be visualized using biplots. The chips may represent different genetic
materials, different treatments or combinations of them.
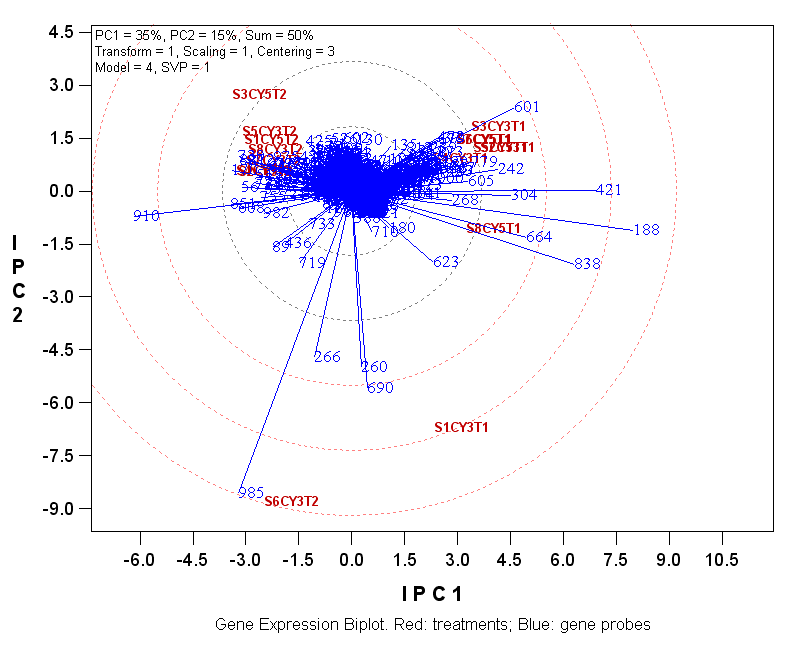
The following biplot is based on the sample gene
probe by treatment data from the June 2005 Gene Expression Data Analysis
Workshop held in ISU provided by Dr. Dan Nettleton
(http://www.public.iastate.edu/~dnett/MicroShortCourse/data.txt).
The data was log transformed ("transform = 1"),
followed by scaling using treatment (chip) standard deviation ("scaling = 1"),
and followed by double-centering ("centering= 3") before subjecting to SVD, as
indicated by the model description in the upper-left of the biplot.
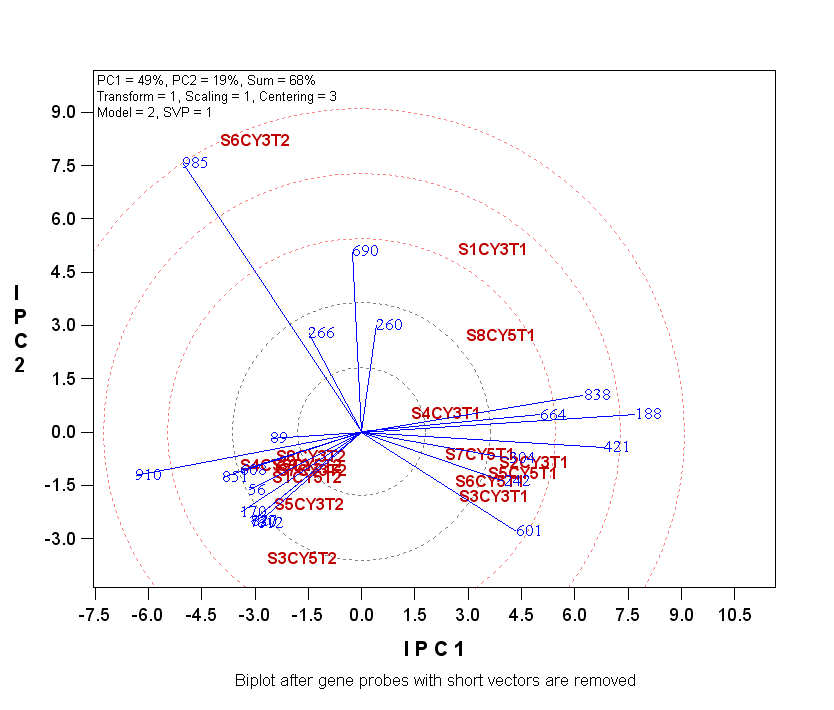
The biplot shows that the treatments fell into two
large groups plus two isolated treatments. The gene probes that have long vectors are
those that had differential expression levels in the treatments. Specifically,
probes 188, 421, 838 had higher relative expression levels for treatments with T1's than in
those with T2's,
whereas probe 910 was just the opposite. In addition, treatment 's6cyt2' had
very high relative expression level of 985. Treatments s6cyt2 and 's1cy3t1' both
had high relative expression levels for probes 985, 690, 260, and 266.

