Functions for a QTL Mapping Dataset
-
Generate a linear map among all or a subset of the genetic
markers;
-
Identify quantitative trait loci (QTL) of a trait at a
user-specified association level;
-
Identify
QTL using specified markers/traits as co-variables.
-
Identify traits that are influenced by a single locus (pleiotropic
effects);
-
Visualize the genetic constitution of each individual
plant or line with regard the markers;
-
All
functionalities for a genotype by trait dataset.
-
NOVEL: QTL identification based on phenotypic
data from multiple environments.
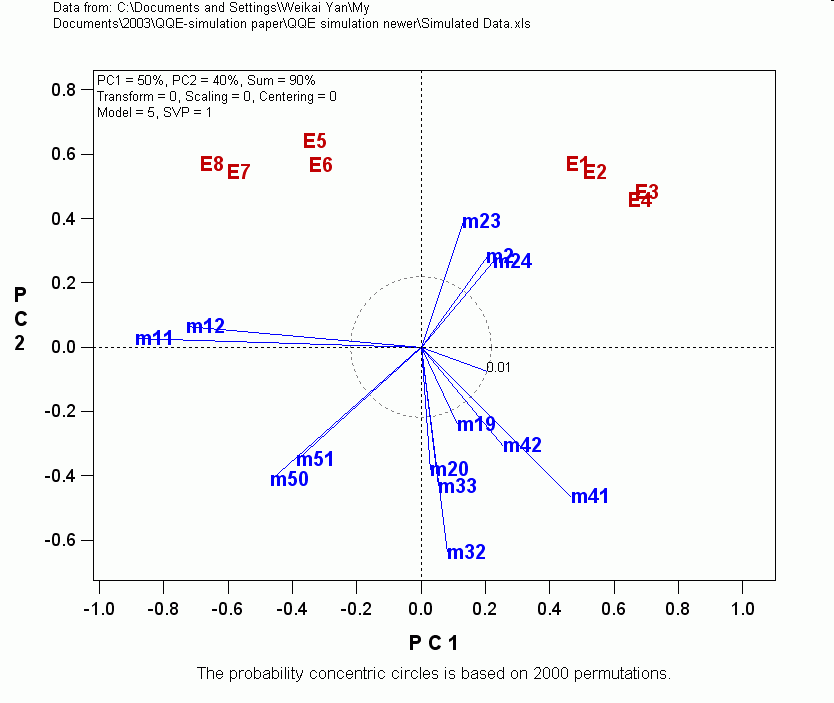
The
following is a biplot that correctly identified 7 QTLs based on phenotypic
data from eight environments (E1-E8). Markers are from m1 to m63. The
mapping population has 400 double haploids. If you have any experience in
QTL mapping, you will see the novelty and advantage of the QTL mapping
strategy immediately. The 7 QTLs were simulated to be m2-m3, m11-m12,
m19-m20, m23-m24, m32-m33m, m41-m42, and m50-m51. The QTLs are closer to the
first marker of each pair. Markers that had vectors shorter than the 1% level
vector were removed.
Contact Dr. Weikai Yan
(wyan@ggebiplot.com) for more information
about this methodology.
