GGEbiplot Pattern Explorer

Complete solution to biplot analysis, video game for scientists


Functionality

GGEbiplot functions

Functions for a 4-Way Dataset

Variable-by-Variable Biplot

Association Biplot

Genotype by env. biplot

Genotype by trait biplot

QTL mapping biplot

QTL by environment biplot

Gene expression biplot

Diallel cross data biplot

Host by pathogen biplot

3D-Biplot

Free User-friendly ANOVA

Breeder's Kit


Information 

Biplot Analysis Instructions

GGEbiplot Beta download

GGEbiplot License

Biplot Analysis Presentations

User's feedback

GGE biplot publications by users

GGE biplot publications

References on biplot analysis

Home

Contact us


Functions for QTL mapping with phenotypic data from multiple environments


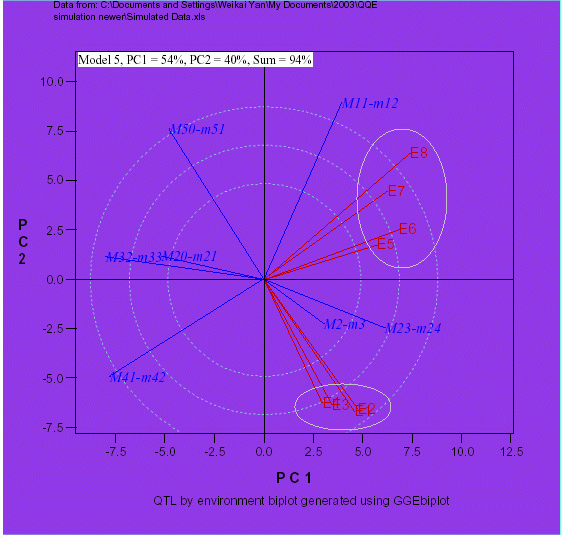
For QTL mapping data with traits measured in multi-environment trials, a QQE biplot can be generated, which can be used to

  • visualize the effect of a marker in different environments,

  • identify QTL mapping based on phenotypic data from multiple environments,

  • visualize the mean effect of a QTL and its stability across environments,

  • visualize the specific QTL by environment interactions,

  • visualize mega-environment differentiations based on the QTL by environment patterns, and

  • interpret GE interaction in terms of QTL by environment interactions.


Contact us